Comprehensive Build Analytics
Track time for each build stage, monitor build volume over time, and track deployment success/failure rates across multiple environments.


.svg)


Powerful capabilities to monitor, analyze, and optimize your CI/CD pipeline performance
Track time for each build stage, monitor build volume over time, and track deployment success/failure rates across multiple environments.
Identify most active services, find services with deployment issues, and maintain complete deployment audit trail.
Filter by tenant, vertical, and pod with flexible date range selection and shareable links for filtered views.
Interactive charts with hover details, expandable fullscreen views, and color-coded metrics for visual distinction.
Comprehensive components to track build performance, deployment history, and service analytics
Dynamic summary cards showing average performance times for different build stages.
Stages Tracked:
Complete deployment audit trail for STG and PROD environments with status tracking and timestamps.
Features:
Top active and unstable microservices with deployment counts and failure tracking.
Features:
Interactive charts and visualizations to understand build patterns, deployment trends, and performance metrics
Bar Chart
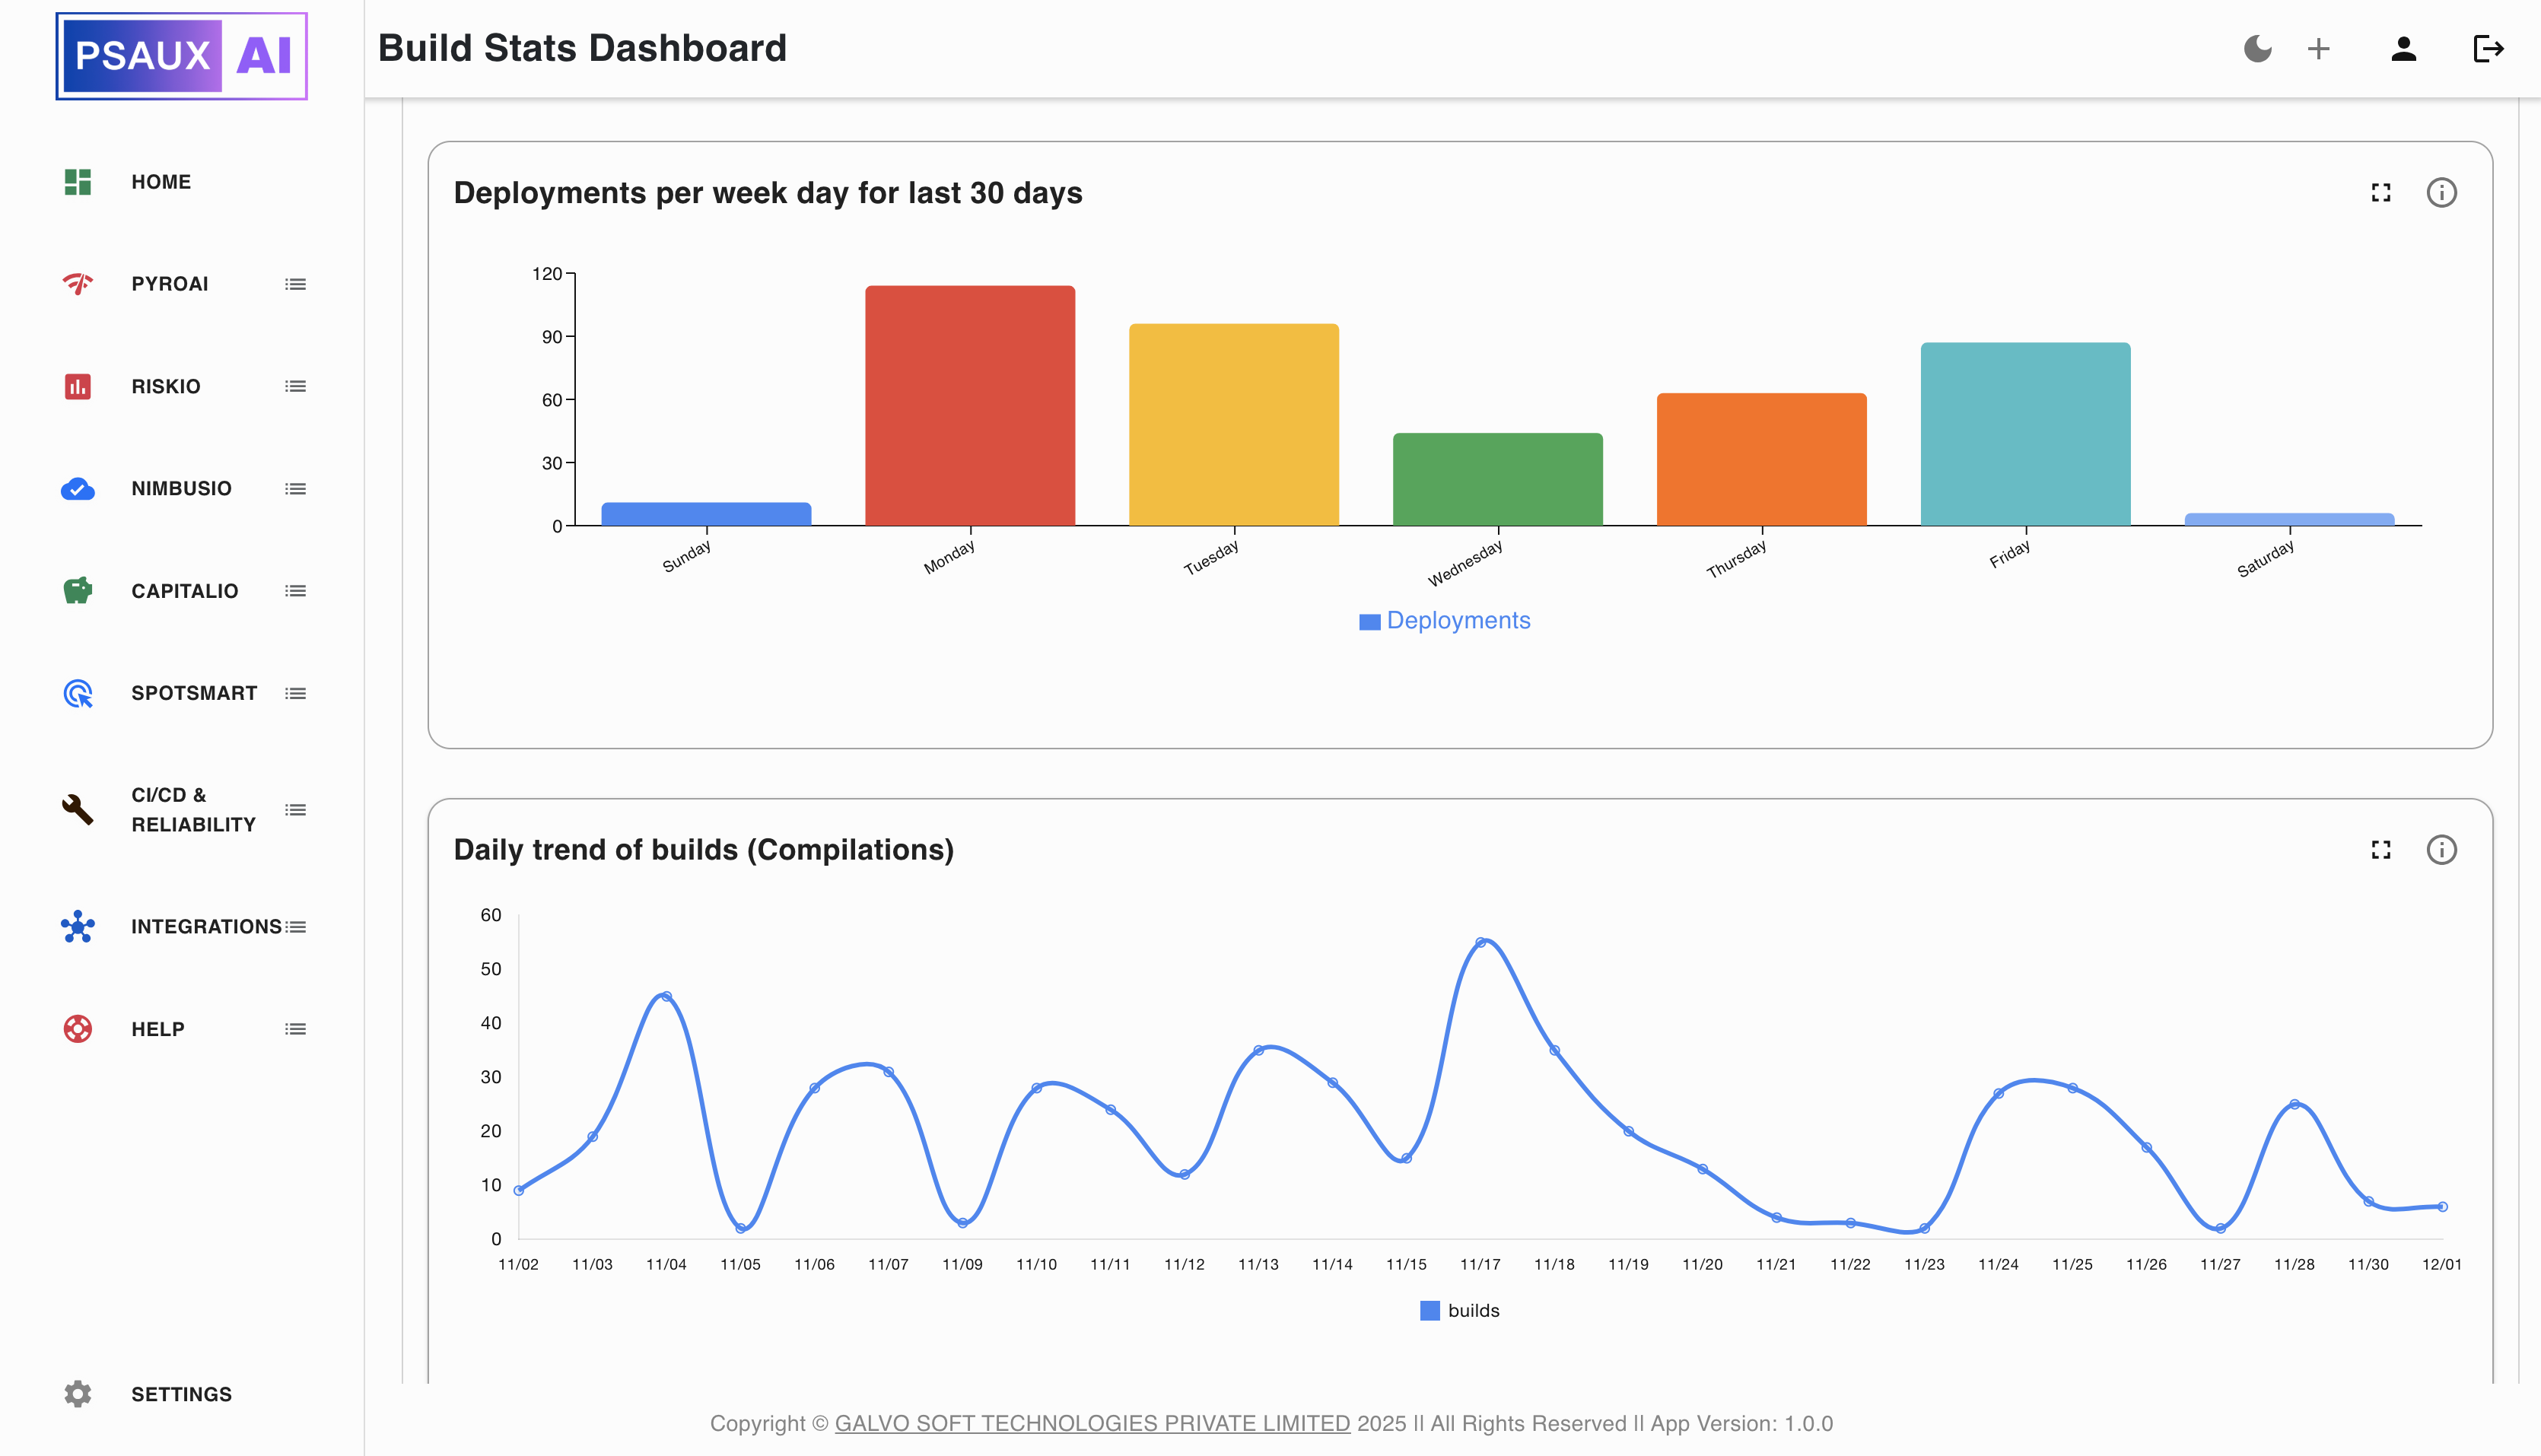
Distribution of deployments across different days of the week to understand deployment patterns.
Features:

Line Chart
Daily build compilation trends over time with smooth line curves and interactive tooltips.
Features:
Multi-line Chart
Deployment trends broken down by environment (DEV, STG, PROD) with multi-line visualization.
Features:
Multi-line Chart
Daily deployment trends showing success and failure rates with dual-line visualization.
Features:
Expandable Bar Chart
Daily performance of different build stages with expandable fullscreen view and color-coded bars.
Features:
Real-world scenarios where build analytics deliver significant value
Identify slow build stages and optimize pipeline performance. Track stage timing to find bottlenecks.
Example: Find that Sonar scan takes 5 minutes, optimize to 2 minutes
Monitor deployment success rates and improve deployment reliability across all environments.
Example: Identify services with 30% failure rate, investigate and fix
Identify unstable services proactively and track deployment issues before they impact production.
Example: Service with 20 failed deployments in a week needs attention
Understand deployment patterns to plan infrastructure resources and optimize capacity.
Example: Most deployments happen on weekdays, scale down weekends
Join teams that have improved deployment reliability and reduced build times with comprehensive build analytics.